 Share Predictions


Seneca Foods Corp (SENEB) stock analysis and AI prediction
The price and company facts of Seneca Foods Corp, with its AI prediction for the next 10 market days in SharePreds.
- Previous close
- $152.18
- Open
- $148.31
- Day range
- $148.31 - $148.31
- Volume
- 303
Close price as of Nov 04, 2026
Keep looking in SharePreds
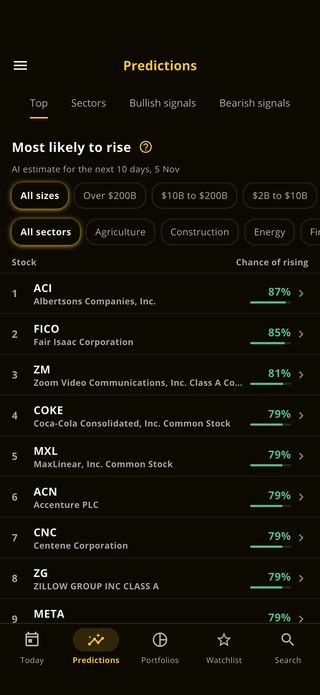
You have looked at today's stocks on this website. SharePreds shows every stock's likelihood of rising, its chart and how its earlier predictions ended, with alerts on the ones you follow.
 Scan with your phone


About Seneca Foods Corp
Seneca Foods Corp is a provider of packaged fruits and vegetables. The facilities are comprised of plants for packaging, can manufacturing, seed production, a farming operation and a logistical support network. It manages its business almost entirely on the basis of two reportable food packaging segments: Vegetable and Fruit/Snack. Majority of revenue comes from Vegetable segment. The Other category comprises non-food operations including revenue derived from the sale of cans, ends, seed, and outside revenue from the company's aircraft operations, and certain corporate items. Its principal product offerings include canned, frozen and jarred fruits and vegetables, as well as packaged snack chips. Its brands are Aunt Nellie's, Cherry man, GREEN VALLEY, Libby's, READ, and SENECA APPLE CHIPS.
- Sector
- Manufacturing
- Exchange
- NASDAQ
- Market value
- $1.0 billion
- Size
- Small cap
- Employees
- 6,895
- Headquarters
- MARION, NY
- Listed since
- June 1, 1972
- Website
- senecafoods.com
More Manufacturing stocks
Other small cap stocks
Keep going
SENEB questions
What is the AI prediction for SENEB stock?
Each market day our model rates Seneca Foods Corp (SENEB) Bullish, Neutral or Bearish for the next 10 market days. Predictions are indicative: they rest on price and volume data, and they can be wrong.
How often is the SENEB prediction updated?
Each market day, Monday to Friday, except market holidays. The date of the prediction is shown beside it.
What do Bullish, Neutral and Bearish mean?
Bullish means the model sees a rise as likely over the next 10 market days, Bearish a fall, and Neutral no clear direction.
Where can I see the exact likelihood for SENEB?
In the SharePreds app for iPhone and Android, with the stock's chart, alerts on it and how its earlier predictions ended.
Where can I see SENEB options?
The SENEB options page opens its calls and puts, with price, volume, implied volatility and the Greeks.