 Share Predictions


SharePreds: stock analysis with AI predictions
An analysis tool for U.S. stocks: charts, indicators and market news, with daily AI predictions, price alerts and how past predictions ended.
 Scan with your phone


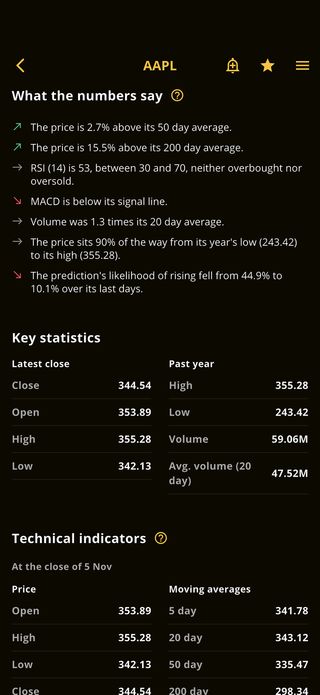
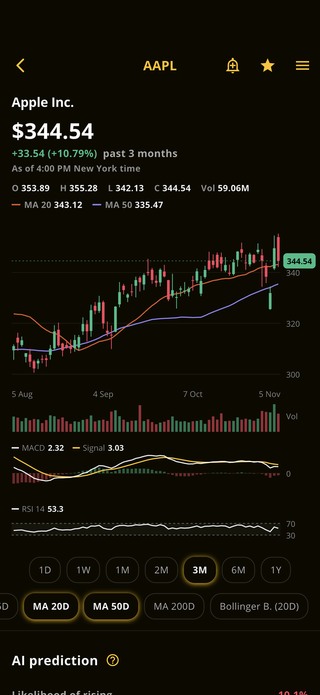
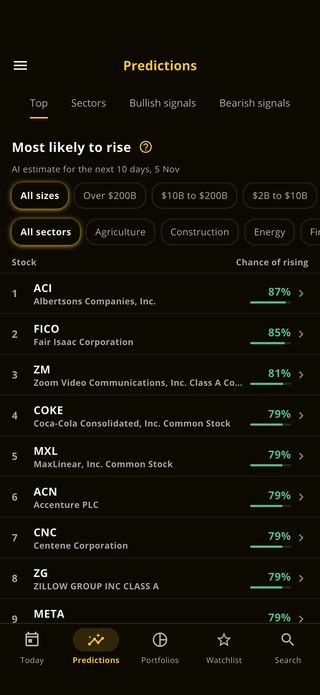
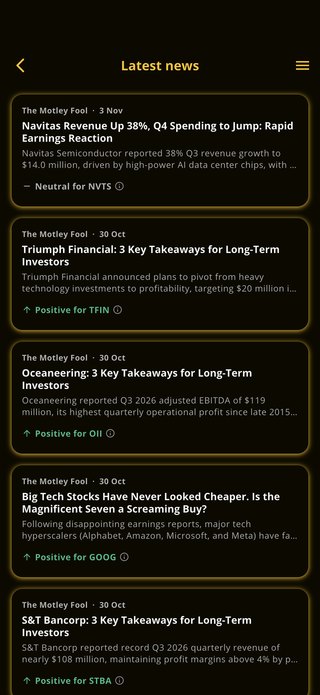
Analyze any stock for yourself
Charts, indicators and plain lines on what a stock's data says, for any stock or ETF.
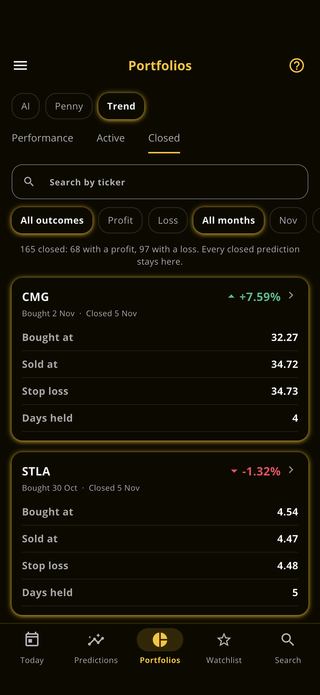
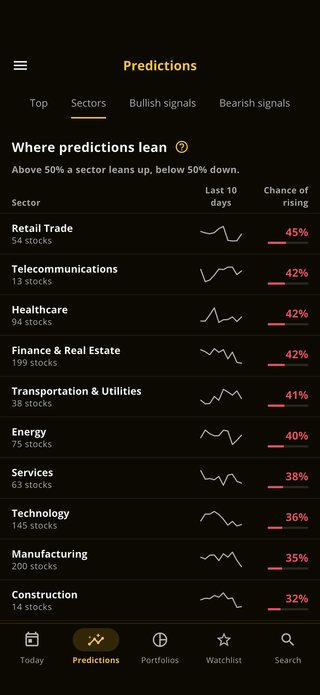
See what our AI model says, and check its record
Each market day, it gives a stock an indicative likelihood of rising over the next 10 days.
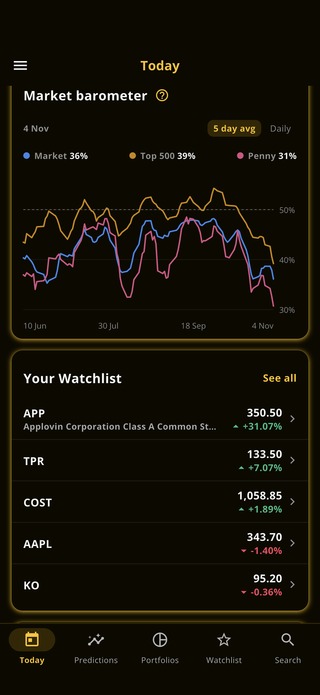
Stay on top of your stocks
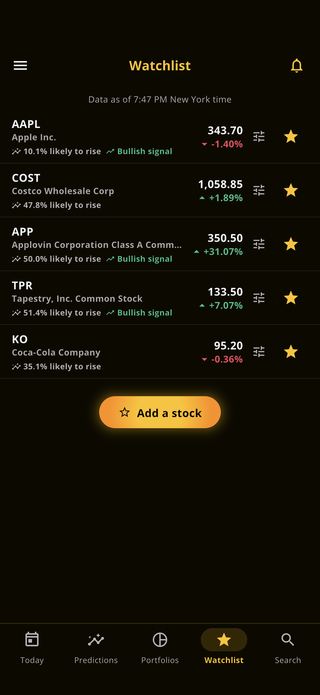
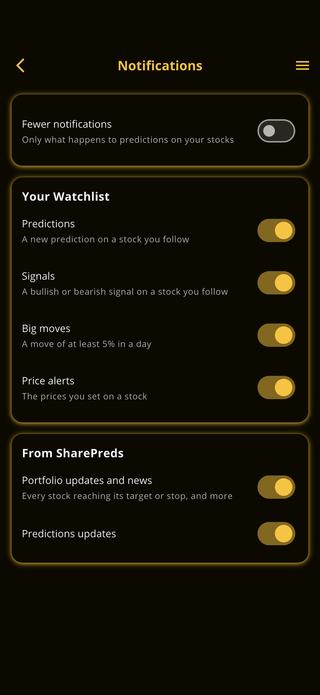
Follow any stock with a star, and choose what you hear about.
Questions about SharePreds
What does SharePreds predict?
Each market day, SharePreds gives a U.S. stock its likelihood of rising over the next 10 days, with its last five days beside it. Predictions are indicative: they rest on price and volume data, and they can be wrong.
Can I see how past predictions ended?
Yes. Every closed prediction stays in the app with the day it was published, its prices and how it ended. You can search the record by stock, month and outcome.
Does SharePreds cover ETFs?
Technical analysis works on any stock or ETF: candlestick charts, moving averages, Bollinger bands, volume, MACD and RSI.
Are the portfolio results real trades?
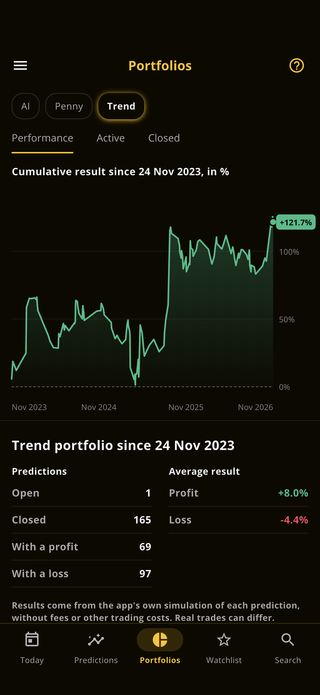
No. They are only a simulation, without fees or other trading costs, shared for educational and informational purposes. Real trades can differ, and past results never guarantee future outcomes.
SharePreds is an analysis tool for information and education. Nothing in the app is financial, investment or trading advice. Predictions are indicative and carry no guarantee, and past results never guarantee future outcomes. All investing carries the risk of losing some or all of your capital.
Our other apps
OpPreds
The options chain, unusual flow and technical analysis, with AI predictions.

CPreds
Crypto charts and technical analysis, AI forecasts and a simulated portfolio.
TradeSim
Practice trading and technical analysis with a virtual portfolio and real market data.
Average Cost
Your true average cost across every buy, and a plan for the next one.