 Share Predictions


Fortis Inc. Common Shares (FTS) stock analysis and AI prediction
The company facts of Fortis Inc. Common Shares, with its price and AI prediction for the next 10 market days in SharePreds.

Keep looking in SharePreds
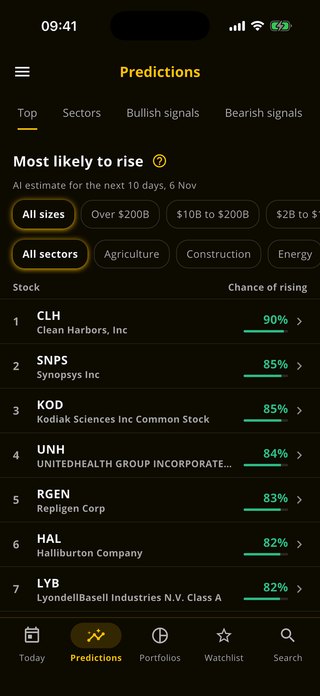
You have looked at today's stocks on this website. SharePreds shows every stock's likelihood of rising, its chart and how its earlier predictions ended, with alerts on the ones you follow.
 Scan with your phone


About Fortis Inc. Common Shares
Fortis owns and operates eight transmission and distribution utility subsidiaries in Canada and the United States, serving 3.5 million electricity and gas customers. The company has smaller stakes in electricity generation and several Caribbean utilities. Subsidiary ITC operates electric transmission in seven US states, with more than 16,000 miles of high-voltage transmission lines in operation.
- Exchange
- NYSE
- Market value
- $30.3 billion
- Size
- Large cap
- Employees
- 9,900
- Listed since
- June 8, 2001
- Website
- fortisinc.com
FTS questions
What is the AI prediction for FTS stock?
Each market day our model rates Fortis Inc. Common Shares (FTS) Bullish, Neutral or Bearish for the next 10 market days. Predictions are indicative: they rest on price and volume data, and they can be wrong.
How often is the FTS prediction updated?
Each market day, Monday to Friday, except market holidays. The date of the prediction is shown beside it.
What do Bullish, Neutral and Bearish mean?
Bullish means the model sees a rise as likely over the next 10 market days, Bearish a fall, and Neutral no clear direction.
Where can I see the exact likelihood for FTS?
In the SharePreds app for iPhone and Android, with the stock's chart, alerts on it and how its earlier predictions ended.
Where can I see FTS options?
The FTS options page explains its calls, puts and Greeks. The full FTS options chain, every strike and expiry, is in the OpPreds app.