 Share Predictions


Options chain search
Calls and puts for any U.S. stock, with price, volume, implied volatility and the Greeks.
Keep searching in OpPreds
You have used today's searches on this website. OpPreds has the full chain of every U.S. stock on your phone, and tells you when a stock you follow has a new prediction.
 Scan with your phone


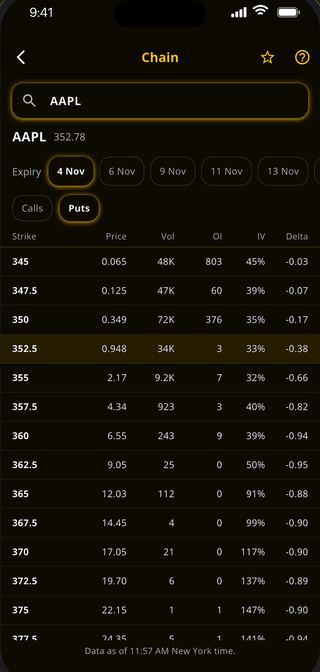
Find a stock
Type a ticker or a company name and pick it from the list.
Set the expiration
Within or after 7, 30, 60 or 90 days. Changing it is not a new search.
Open a contract
Click a row for its Greeks, open interest and break-even price.
Beyond the chain, in your pocket
OpPreds adds unusual flow, alerts and the stock behind each trade, with AI predictions that name their levels and keep every result.
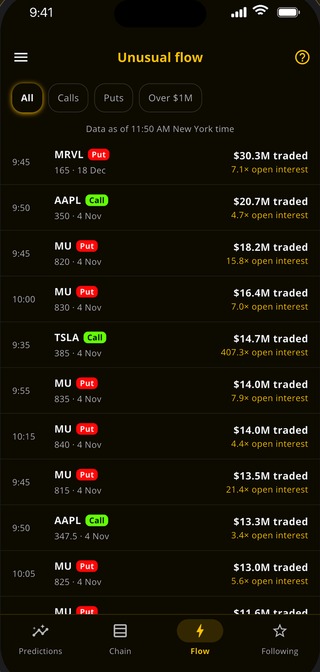
- Unusual flow. Contracts trading far above their open interest.
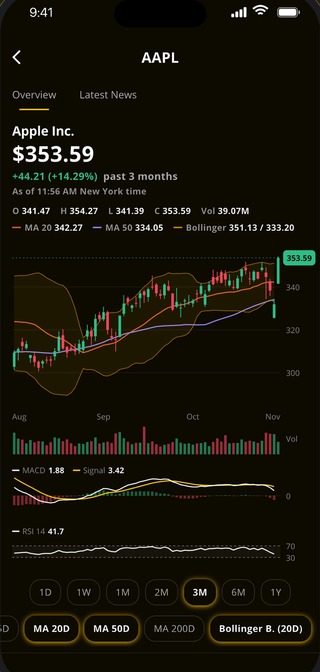
- Technical analysis. Charts, indicators and news on the stock behind each trade.
- AI predictions. The contract, its targets and its stop, for you to judge.
- Alerts. A new prediction, a target or the stop on tickers you follow.
Reading an options chain
- Delta
- How much the option moves when the stock moves $1.
- Gamma
- How fast delta changes as the stock moves.
- Theta
- The value an option loses each day.
- Vega
- How much the price reacts to a change in implied volatility.
- Implied volatility
- The price move the market expects.
- Open interest
- Contracts still open. More usually means easier trading.
- Intrinsic value
- What the option is worth if exercised now.
- Extrinsic value
- The rest of its price: time and volatility.
Questions
What does the options chain show?
For each stock, the 10 most traded calls and puts for the expiration you choose: strike, price, volume, implied volatility and delta. Open a row for gamma, theta, vega, open interest, intrinsic and extrinsic value, and the break-even price.
How many stocks are covered?
Over 6,000 U.S. stocks. Type a ticker or a company name, such as AAPL, TSLA, NVDA or SPY.
What do the Greeks mean?
Delta shows how much an option's price moves when the stock moves $1. Gamma shows how fast delta changes. Theta is the daily loss of time value. Vega shows how much the price reacts to a change in implied volatility.
What is the difference between calls and puts?
A call gives the right to buy shares at the strike price, and gains when the stock rises. A put gives the right to sell shares at the strike price, and gains when the stock falls.
How many searches can I make?
3 stocks a day on this website. The OpPreds app has the full chain, every strike and expiry, on your phone.